Work
Project type
Interactives
Interactives
Newspaper
The Virginian-Pilot
The Virginian-Pilot
Project URL
hamptonroads.com/2013/04/econo...
hamptonroads.com/2013/04/econo...
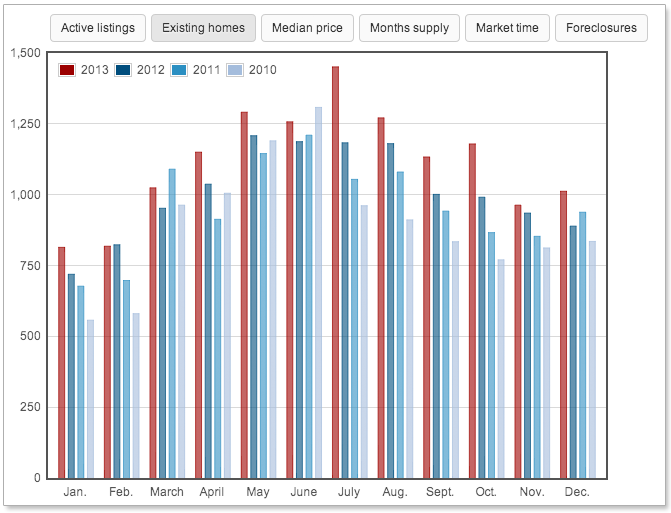
The economic indicator charts gauge the health of the local economy. I used the flot.js library to plot data that reporters enter into Google spreadsheets. I used tabletop.js library to tie the data to the charts.
